
Cases
= 6,154Crude Rate
(per 100,000) = 104.3Sex specific rates
:Female = 108.8
Male = 99.8
Race specific rates
:African American = 839.2
White = 24.3
Other = (90 cases)
Indiana gonorrhea morbidity has been slowly decreasing during 1999. Considering the number of syphilis cases, this is quite unusual. The most significant decrease has been in the race specific case rate among African Americans (931.3 in 1998 to 839.2 in 1999). Figure 1 shows the number of cases of gonorrhea in Indiana for the last five years. The number of cases for 1999 is at their lowest point in the last five years. (All data taken from ISDH STDMIS.)
Figure 1.

Table 1.
|
Age |
Cases |
Rates |
|
0-9 |
21 |
2.5 |
|
10-14 |
102 |
24.3 |
|
15-19 |
1,890 |
425.5 |
|
20-24 |
1,913 |
485.4 |
|
25-29 |
912 |
220.5 |
|
30-34 |
504 |
118.6 |
|
35-39 |
338 |
69.9 |
|
40-44 |
205 |
42.9 |
|
45-49 |
94 |
22.7 |
|
50-54 |
56 |
16.2 |
|
55-59 |
21 |
7.5 |
|
60-64 |
18 |
0.8 |
|
65+ |
8 |
1.1 |
|
Unknown |
72 |
|
|
Total |
6,154 |
104.3 |
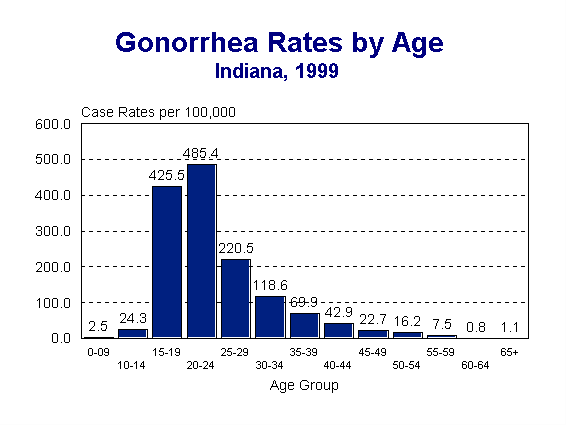
From 1998 to 1999, the only age group to show any significant reduction has been the 15-19 year olds, with a reduction of nearly 200 cases of gonorrhea. As with chlamydia, the highest age ranges are 15-24 year olds, as can be seen in Figure 2.
Figure 2
Very few cases of penicillinase producing Neisseria gonorrhoeae (PPNG) were reported prior to 1989. In 1990, all public STD clinics in Indiana as well as family planning clinics began to treat gonorrhea with non-penicillin regimens. The decrease in the proportion of PPNG isolates may reflect this change in treatment.
Table 2 shows the gonorrhea cases and rates by metropolitan areas for three of the counties with the highest incidence: Allen, Lake, and Marion Counties. Although these counties comprise only 28% of the population, they account for 65% of the reported cases in 1999.
Table 2.
|
County |
Number of Cases |
Rates per 100,000 |
|
Allen |
503 |
162 |
|
Lake |
484 |
101 |
|
Marion |
3,048 |
373 |
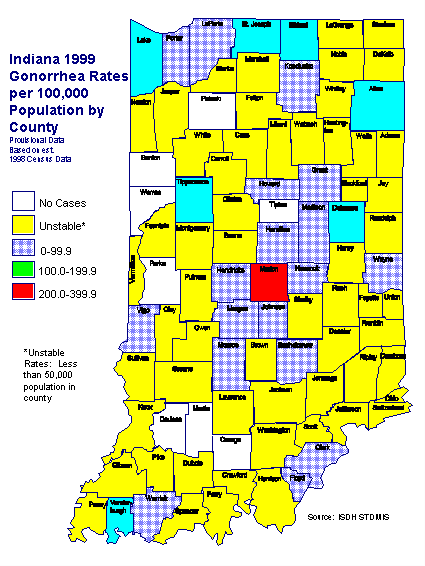
Figure 3 is a map of Indiana showing the case rates per 100,000 for 1999. Case rates are based on 1998 census data.
Figure 3.
Cases
= 621Crude Rate
(per 100,000) = 13.6Sex specific rates
:Females = 10.6
Males = 10.4
Race specific rates
:African American = 116.8
White = 0.9
Other = (16 cases)
Figure 4 shows the number of early syphilis cases reported for 1995 through 1999. Due to an outbreak of syphilis in Marion County, the number of syphilis cases increased dramatically in 1999. Of the 621 cases of early syphilis reported in 1999, only 113 were found outside Marion County. The reduction in case incidence in other areas of the state had masked the increases in 1998 in Marion County. Disease increases began in mid-1998 and continue.
Figure 4.
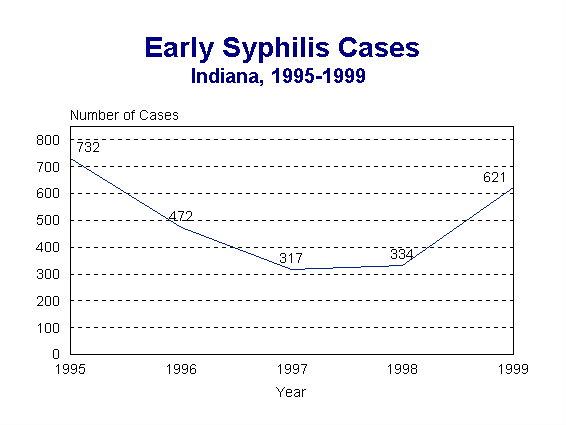
Table 3 depicts the number of early syphilis cases and case rates per 100,000 for 1999. (Case rates based on 1998 census data.) Syphilis in all age categories under 50 has increased from 1998 to 1999. Figure 5 visually illustrates the high rate of syphilis among those 20-40 years of age. In 1998, the age of those infected averaged 34 years. In 1999, it has decreased slightly to 32 years of age. This decrease may signal a continuation downward in the ages of those infected with syphilis.
Table 3.
|
Age |
Cases |
Rates |
|
0-9 |
9 |
1.1 |
|
10-14 |
4 |
1.0 |
|
15-19 |
74 |
16.7 |
|
20-24 |
139 |
35.3 |
|
25-29 |
127 |
30.7 |
|
30-34 |
128 |
30.1 |
|
35-39 |
106 |
21.9 |
|
40-44 |
72 |
15.1 |
|
45-49 |
55 |
13.3 |
|
50-54 |
33 |
9.5 |
|
55-59 |
14 |
5.0 |
|
60-64 |
15 |
6.5 |
|
65+ |
24 |
3.4 |
|
Unknown |
3 |
|
|
Total |
803 |
13.6 |
Figure 5.
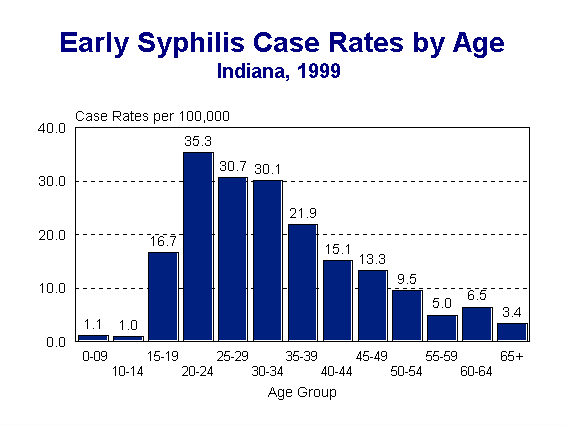
Figure 6 is a map of Indiana showing cases and case rates of primary and secondary syphilis for 1999.
Figure 6.

Cases
= 11,884Crude Rate
(per 100,000) = 201.5Sex specific rates
:Female = 313.8
Male = 82.0
Race specific rates
:African American = 1011.2
White = 90.6
Other = (287 cases)
While Chlamydia Trachomatis has been known to cause sexually transmitted genital infection for a number of years, only recently have economical and practical diagnostic methods been available to physicians. Recent innovations in chlamydia testing have made the test results much more accurate than in previous tests. This may account for some of the increase in the number of cases for 1999 and will be an even greater factor for year 2000 data as more accurate tests become available. Increases also occur as screening sites are added to the program, giving more women the opportunity to be tested for chlamydia.
Figure 7.
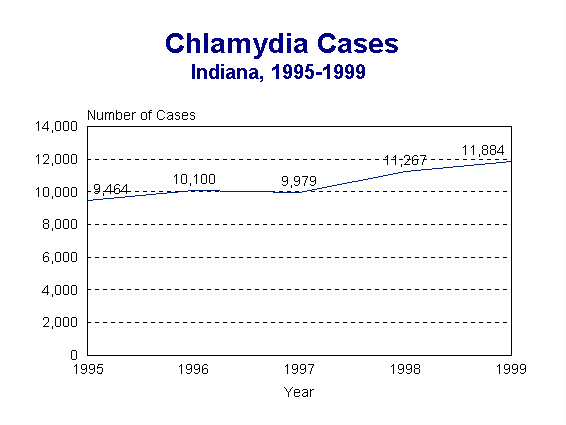
There is a higher prevalence of chlamydia in females; however, this date must be interpreted with caution as chlamydia screening programs preferentially test females. This is due in large part to screening of young females at high risk of infection through the federally funded efforts of the Indiana STD Program and the Indiana Family Health Council. Chlamydia infection in males is often diagnosed as non-gonococcal urethritis, which is not reportable. This has led to an underestimation of chlamydia morbidity in males. As family planning clinics begin to see male patients and STD clinics to test males for chlamydia, this reporting difference may begin to decrease.
Table 4 summarizes the age specific cases for chlamydia trachomatis infection for 1999. Figure 6 clearly shows the greatest number of cases continues to be found in the 15-19 and 20-24 year age ranges with almost no chlamydia infection after the age of 40 years. (Case rates based on 1998 census data.)
Table 4.
|
Age |
Cases |
Rates |
|
0-9 |
33 |
4.0 |
|
10-14 |
274 |
65.3 |
|
15-19 |
5,008 |
1127.4 |
|
20-24 |
3,988 |
1011.8 |
|
25-29 |
1,430 |
345.7 |
|
30-34 |
508 |
118.3 |
|
35-39 |
270 |
55.8 |
|
40-44 |
97 |
20.3 |
|
45-49 |
37 |
8.9 |
|
50-54 |
12 |
3.5 |
|
55-59 |
15 |
5.4 |
|
60-64 |
3 |
1.3 |
|
65+ |
4 |
0.5 |
|
Unknown |
205 |
|
|
Total |
11,884 |
201.5 |
Figure 8.
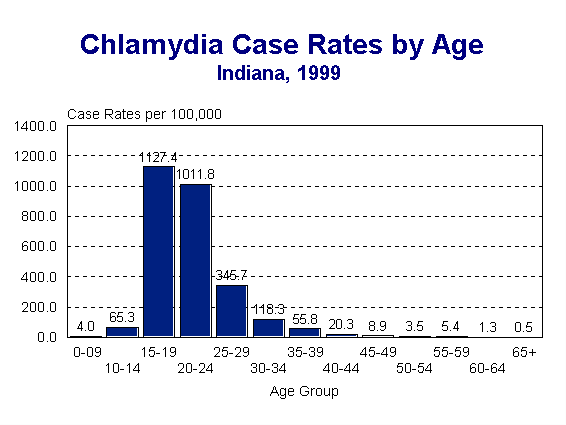
Figure 9.
