[an error occurred while processing this directive]
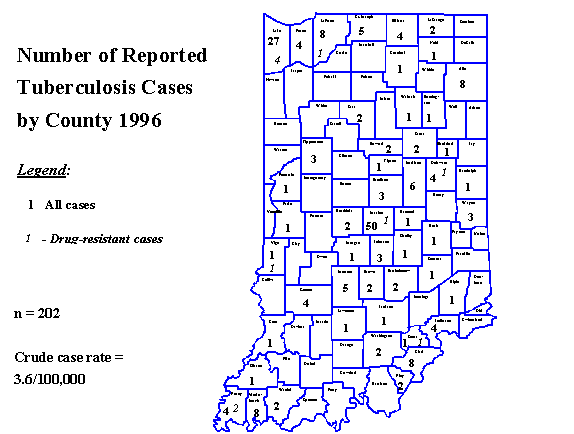
Cases = 202
Crude Rate (per 100,000 population) = 3.6
Race/Ethnicity-specific Rates (per 100,000)
Includes foreign-born
White = 2.2
Black = 14.8
Asian = 42.5
Hispanic = 12.1
Sex-specific Rates (per 100,000)
Female = 2.8
Male = 4.5
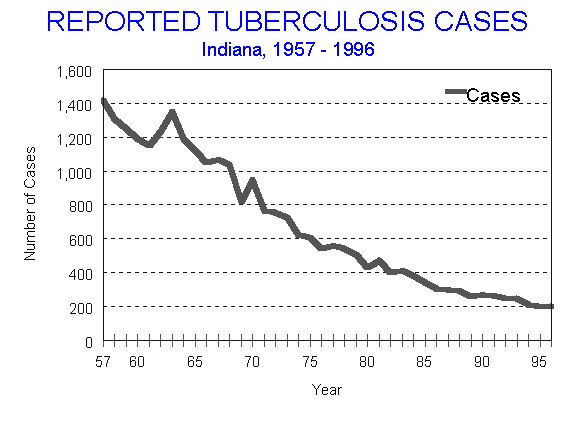
During 1996, Indiana reported 202 new cases of tuberculosis for a state case rate of 3.6 cases per 100,000 population. This number was not a significant increase over the 199 reported cases the previous year. TB was reported in 50 of the 92 Indiana counties; higher numbers were reported by more densely populated counties.
Tuberculosis-1 shows the decline in cases over several years.Tuberculosis-1

Males had a case rate of 4.5 and females a rate of 2.8. The case rates by race and ethnicity are 2.2 for Whites, 14.8 for Blacks, 42.5 for Asians, and 12.1 for Hispanics. Foreign-born individuals represented 14.9% (30/202) of the total cases. When only U.S. born individuals are included, case rates fall to 2.2 for Whites, 13.2 for Blacks, 3.0 for Hispanics, and zero for Asians (
Tuberculosis-2).Tuberculosis-2

Screening efforts for the foreign-born coming from countries where TB is epidemic must continue so cases are diagnosed promptly and appropriate therapy initiated.
Tuberculosis-3 shows from which region the foreign-born are coming.Tuberculosis-3
Distribution of Foreign-Born Tuberculosis Cases
by World Health Organization (WHO) Regions
Indiana, 1992 and 1996
|
WHO Region |
1992 |
1996 |
|
Africa |
0 |
1 |
|
Americas |
7 |
8 |
|
Eastern Mediterranean |
0 |
0 |
|
Europe |
0 |
4 |
|
Southeast Asia |
14 |
10 |
|
Western Pacific |
3 |
7 |
|
TOTAL |
24 |
30 |
Refugees are one group of foreign-born who are resettled in Indiana. In 1996, 388 refugees were resettled in Indiana. Nineteen counties received refugees with the top three counties being Marion with 33.8%, Allen 25.8%, and St. Joseph 14.9%. The overall refugee infection rate was 25/100,000. Due to the relatively high rate of disease in these populations, foreign-born cases contributed about 15% (30/202) of the total TB caseload in Indiana.
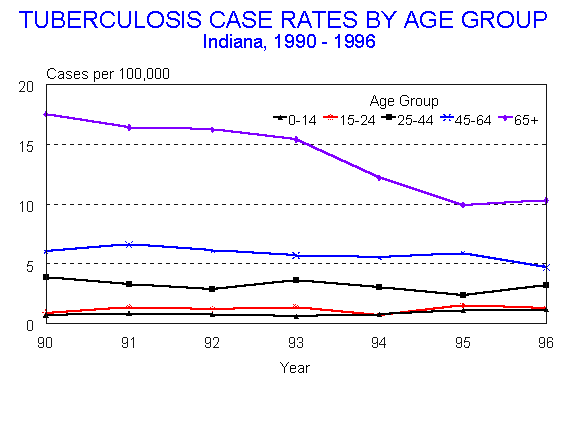
Age continues to be a factor in development of TB. Those aged 65 and over had a case rate of 10.3/100,000 and the age group 45-64 had a rate of 4.7. TB disease among the younger age groups generally indicates recent transmission. The rate for the age group 25-44 was 3.2 and 1.3 for the age group 15-24. The youngest age group 0-14, had a case rate of 1.2.
Tuberculosis-4 shows the case rates by age group from 1990 through 1996.Tuberculosis-4
Thorough and complete contact investigations are an integral part of a TB prevention strategy. Of the 14 children diagnosed with TB disease in 1996, 7 of these children were identified as having a history of exposure to an adult case. Two had other high risk factors such as living in a homeless shelter or coming from a country where TB is epidemic. The remaining five had no history of exposure, no risk factors identified, and no known source of the disease.
The age group 25-44 merits closer monitoring since this is the age group most impacted by HIV disease. The connection between TB and AIDS has been clearly documented and TB disease must be promptly diagnosed and treated in coinfected individuals. Of the 202 reported TB cases in 1996, 12 were also diagnosed with AIDS. This number has been compiled through a confidential registry match first conducted in 1986.
Tuberculosis-5 shows the number of TB cases diagnosed with confirmed AIDS. Complete reporting of both diseases is essential so this trend can be closely monitored and appropriate program resources redirected to address this emerging public health concern.Tuberculosis-5

Other risk factor information is collected from the TB Report Forms. These data are summarized in
Tuberculosis-6. Residents of long-term care facilities accounted for 8.9% (18/202) of TB cases, alcohol use was reported by 5.4% (11/202), 3.5% (7/202) were reported as being homeless, and 2.5% (5/202) were inmates of a correctional facility or jail. No case reports indicated injecting or non-injecting drug use.Tuberculosis-6
Reported Tuberculosis Cases
by Risk Factor, 1996 (n=202)
|
Risk Factor |
Number of Cases |
% of Total Cases |
|
Resident of a long-term care facility |
18 |
8.9 |
|
Excess alcohol use |
11 |
5.4 |
|
Homeless |
7 |
3.5 |
|
Correctional facility inmate |
5 |
2.5 |
Occupation is also collected on the TB Report. Compilation of these data show 61.0% (124/202) of the individuals diagnosed with TB disease were unemployed and 26.6% (53/202) were employed at the time of diagnosis. The unemployed category predominates primarily because it includes individuals who are retired as well as students. Seven health care workers (HCW) were diagnosed with disease. This category includes all individuals who work in a health care facility, regardless of their particular area of work. The summary is shown in
Tuberculosis-7.Tuberculosis-7
Reported Tuberculosis Cases
by Occupation, 1996 (n=202)
|
Occupation |
Number of Cases |
% of Total Cases |
|
Unemployed |
124 |
61 |
|
Other occupations |
46 |
22.7 |
|
Unknown |
26 |
12.8 |
|
HCW |
7 |
3.5 |
|
Corrections |
0 |
0 |
The case data in this report are compiled from those reports submitted by local health departments. The cases are verified and categorized into three general categories. "Confirmed" cases are those in which M. tuberculosis has been isolated from a clinical specimen OR M. tuberculosis has been demonstrated from a clinical specimen by nucleic acid amplification (NAA) test OR acid-fast bacilli (AFB) are seen when a culture has not or cannot be obtained. A "Clinical" case is one in which the individual has a positive skin test, an abnormal chest x-ray, symptoms suggestive of TB, and improves on TB therapy. The third is "Provider Diagnosis". This category includes those cases where the physician has determined the individual has TB, is treating with an appropriate regimen, and the patient is improving clinically. Many in this category include extrapulmonary TB and children where laboratory confirmation may be lacking due to the disease site.
Tuberculosis-8 summarizes the reported TB cases by verification criteria.Tuberculosis-8
Summary of TB Case Verification
Indiana, 1993-1996
|
Verification Category |
1993 |
1994 |
1995 |
1996 |
|
Confirmed by Positive Lab Tests |
199 80.2% |
165 78.2% |
149 74.8% |
156 77.2% |
|
Clinical Case |
36 14.5% |
29 13.7% |
37 18.6% |
29 14.4% |
|
Provider Diagnosis |
9 3.6% |
14 6.6% |
11 5.5% |
17 8.4% |
Of the 202 cases in 1996, 87.6% (177/202) were pulmonary cases. Pulmonary cases are of particular concern since these cases can transmit the disease. In order to interrupt this cycle of transmission, appropriate therapy must be initiated and continued for the duration of the therapy period. Since 1993, an initial drug regimen consisting of three or four drugs has been promoted. In 1996, 83.2% (168/202) of the cases were started on a multiple drug regimen. Only 11.9% (24/202) were started on a two-drug regimen.
Preventing the emergence of drug resistance is a major public health challenge. The most important strategy to prevent resistance is Directly Observed Therapy (DOT), where a health care worker observes and verifies ingestion of the medications. DOT is now a standard of care in Indiana. During 1996, 49.0% (99/202) of all the cases reported in the state received DOT, an increase over the previous year when 33.7% of the cases received DOT (
Tuberculosis-9).Tuberculosis-9
Number and Percent of TB Cases Receiving DOT
Indiana, 1993 - 1996
|
Year |
Number on DOT |
% on DOT |
Total TB Cases |
|
1993 |
48 |
19.4 |
248 |
|
1994 |
31 |
14.7 |
211 |
|
1995 |
67 |
33.7 |
199 |
|
1996 |
99 |
49.0 |
202 |
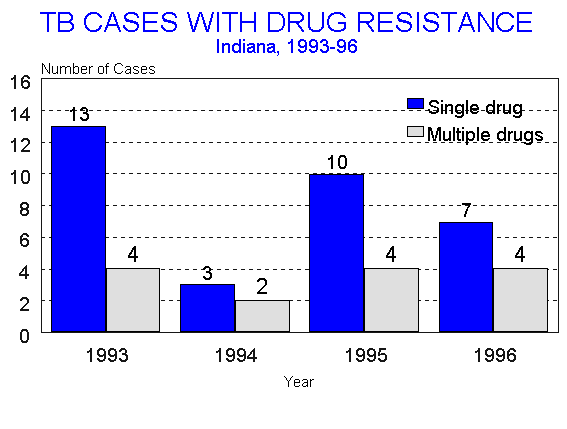
Drug susceptibility testing can be performed on positive cultures; antimicrobial susceptibility testing was performed on 94.5% of the cases. In 1996, eleven cases (5.4%) were resistant to at least one first-line drug. Drug resistance was documented in Lake, LaPorte, Delaware, Marion, Vigo, Scott, and Posey counties. Four of the eleven cases were resistant to two or more drugs and eight of eleven showed resistance to isoniazid (INH), one of the most effective TB drugs. Drug resistant cases often require a longer therapeutic period. During 1996, there were an additional 12 cases followed by local health departments as a result of drug resistance diagnosed in previous years. This point exemplifies the advantage of preventing drug resistance as opposed to managing it long-term. The number of drug resistant TB cases since 1993 is shown in
Tuberculosis-10.Tuberculosis-10
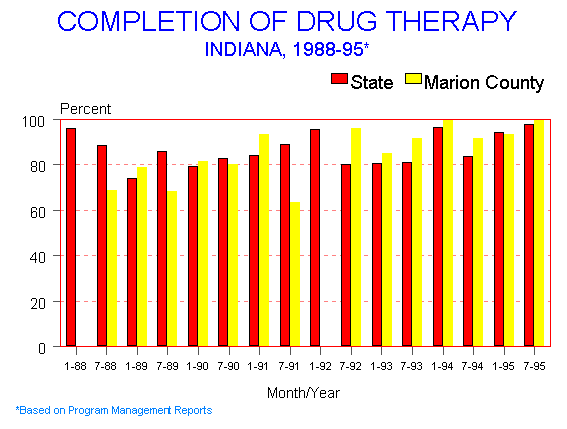
The top priority of TB control efforts is to ensure completion of therapy after a patient is diagnosed with TB and therapy is initiated. The objective is to have at least 90% of the patients complete adequate and appropriate therapy within twelve months. Because completion data are gathered at the end of therapy, the current data are for those individuals who started therapy in 1995. During the first half of 1995, the state index was 94.1% and Marion County was 93.3%. For the second half of the year, the state index increased to 97.7% and Marion County to 100% (
Tuberculosis-11).Tuberculosis-11
Preventing potential cases of TB is accomplished through targeted screening of at-risk groups and the initiation and completion of preventive therapy. A thorough and inclusive contact investigation is the best means of identifying those individuals who have been exposed or who may be the source case. During 1996, 177 pulmonary cases were diagnosed and 77.4% (137/177) of those cases had contacts identified. For the State, the median number of contacts identified was 5 and the median number of contacts tested was 4. For Marion County, the median number of contacts identified was 7 and the median number of contacts tested was also 7. As a result of the follow-up, thirteen of the contacts were found to have TB. Of the 282 with TB, 62.1% (175/282) were started on a course of preventive therapy. Children represented 14.6% (541/3703) of the total number of contacts identified and 87.9% were started on a course of preventive therapy. Completion of preventive therapy rates are 66.8% for the State and 81.9% for Marion County during the last half of 1995. This trend is shown in
Tuberculosis-12.Tuberculosis-12

Tuberculosis-13
is a map of Indiana by county. The numbers represent the number of cases per county with the number of drug-resistant cases is the dark square. The distribution of cases clearly shows that urban, suburban, and rural counties are affected by TB. For this reason, it is essential that a strong infrastructure be in place to manage a case when it occurs to prevent further transmission to others. Thorough and complete contact investigations is essential to prevent further transmission and to insure timely treatment of contacts.Tuberculosis-13
Back to Table of Contents